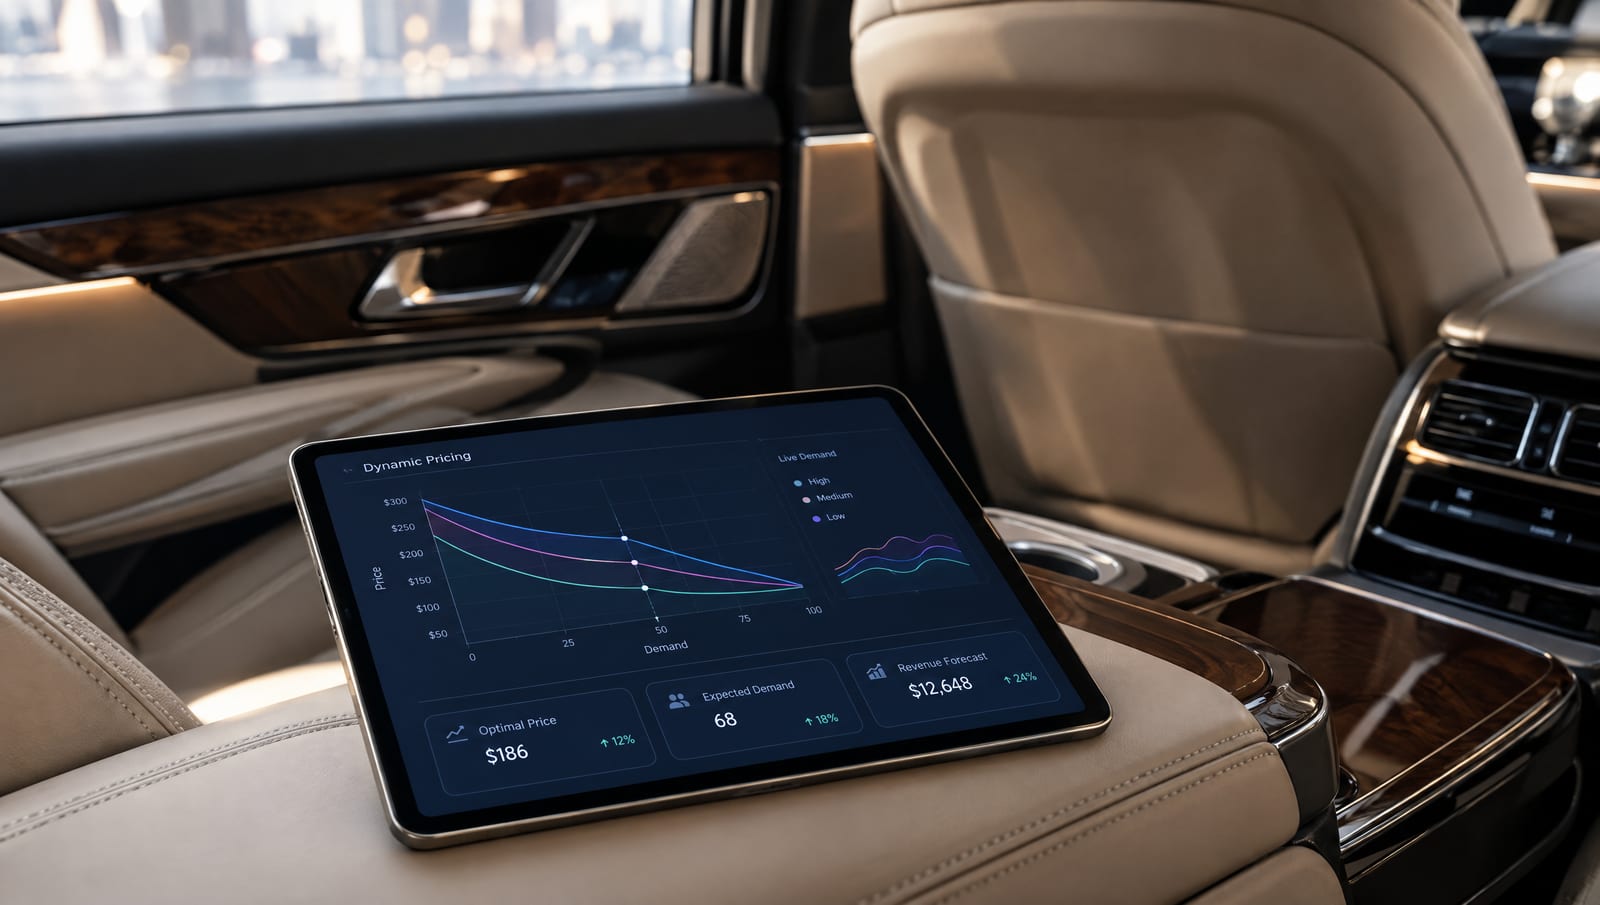
Overview of Limousine Service KPIs for 2026
The limousine service KPIs to track in 2026: financial, operational, and customer metrics, with benchmark ranges for ground-transportation operators.

On this page
- What Financial Performance Metrics Should Limousine Operators Track?
- Which Operational KPIs Measure Limo Service Efficiency?
- What Customer and Marketing Metrics Drive Limo Growth?
- How Do You Measure Fleet and Resource Utilization?
- Which Traditional Limo KPIs Can Mislead Operators?
- Summary Table: Limousine Service KPI Benchmarks for 2026
- What Are the Limitations of These KPI Benchmarks?
- Bottom line: Key Takeaways for Limousine KPIs in 2026
- Frequently Asked Questions
Quick answer: Track four groups of limousine service KPIs in 2026: financial (gross profit margin, revenue per available vehicle hour, cost per mile), operational (fleet utilization, on-time performance, driver productivity), customer (acquisition cost, lifetime value, retention, Net Promoter Score), and market positioning. Fleet utilization and on-time performance matter most, because both drive profitability and retention.
Limousine service KPIs help operators handle the luxury transportation industry’s challenges in 2026: shifting consumer expectations, regulatory changes, and competition from ride-sharing platforms. Market analysts project continued volatility despite growing demand for premium mobility services, so successful operators rely on disciplined performance tracking.
Limousine service KPIs have moved beyond traditional metrics like revenue per mile or fleet utilization rates. Today’s successful operators monitor dashboards that include:
- customer satisfaction scores
- digital booking conversion rates
- driver retention percentages
- real-time profitability margins.
The North American limousine services market demands that operators track both operational efficiency and customer experience metrics to stay competitive.
What separates thriving limousine businesses from struggling ones isn’t just tracking the right numbers. It’s understanding which metrics correlate with long-term profitability. In practice, operators who focus on leading indicators like booking-to-service conversion rates and customer lifetime value tend to get an earlier, clearer read on profitability than those who rely only on lagging financial metrics.
The most successful limousine services measure performance across four areas: financial performance, operational efficiency, customer satisfaction, and market positioning. Understanding how these interconnected metrics work together creates a foundation for sustainable growth. A single reporting dashboard makes it easier to watch them together.
What Financial Performance Metrics Should Limousine Operators Track?
Financial success takes more than tracking revenue. Limo profitability metrics form an interconnected framework that reveals the true health of a luxury transportation operation. They go beyond simple profit margins to include:
- asset utilization rates
- customer lifetime value
- operational efficiency ratios that distinguish thriving businesses from struggling competitors.
The foundation is gross profit margin per service type. Corporate contracts typically yield 25-35% margins, while special events can reach 45-60% profitability when properly managed. These figures mean little without context from complementary metrics like fleet utilization rates and driver productivity scores.
Revenue per available vehicle hour (RevPAVH) is a critical benchmark, similar to the hotel industry’s revenue per available room. Top-performing operators tend to achieve higher RevPAVH through strategic pricing and demand management, though the exact lift varies by market and season.
Cost per mile and cost per hour calculations provide the operational foundation for pricing decisions. They must account for fuel, maintenance, insurance, driver wages, and vehicle depreciation to give an accurate view of profitability. For how to turn those costs into rates, see our limo pricing strategy guide.
Understanding these interconnected financial metrics sets up the operational performance indicators that drive day-to-day service delivery.
Which Operational KPIs Measure Limo Service Efficiency?
Beyond financial metrics, operational indicators reveal the underlying health of your service. They affect customer satisfaction and long-term profitability by measuring how efficiently you deliver your core promise.
Fleet utilization rate is the cornerstone operational metric: the percentage of time your vehicles generate revenue versus sitting idle. Industry leaders typically achieve 65-75% utilization during peak seasons, while struggling operators often fall below 50%. It correlates directly with profitability because fixed costs like insurance and vehicle payments continue regardless of usage.
On-time performance is another critical benchmark, with premium services maintaining 95% or higher punctuality rates. Late arrivals don’t just frustrate customers; they cause cascading disruptions to subsequent bookings. Industry guidance for 2026 emphasizes the growing importance of real-time tracking to maintain competitive service standards.
Driver productivity metrics include completed trips per shift and revenue per driver hour. Top-performing drivers typically complete 6-8 trips during standard shifts while maintaining service quality. Pushing productivity too aggressively, however, can compromise safety and customer experience.
Vehicle maintenance efficiency rounds out operational tracking, measuring downtime percentages and maintenance cost per mile. Proactive maintenance programs reduce unexpected breakdowns, supporting both utilization and customer satisfaction. These operational insights set the foundation for understanding how service delivery affects your marketing effectiveness and customer retention.
What Customer and Marketing Metrics Drive Limo Growth?
Customer acquisition and retention metrics reveal the long-term sustainability of your service beyond day-to-day operations. These marketing-focused KPIs directly affect revenue predictability and scalability.
Customer Acquisition Cost (CAC) is your total marketing investment divided by new customers gained in a given period. For limousine services, this includes:
- digital advertising
- referral programs
- corporate sales efforts.
A common pattern shows successful operators keeping CAC below 15% of customer lifetime value.
Customer Lifetime Value (CLV) measures the total revenue expected from a client relationship. Corporate accounts typically generate higher CLV through recurring bookings, while event-based customers may need different retention strategies. Premium service providers often realize higher CLV than budget operators because clients book repeatedly and at higher rates.
Repeat Customer Rate tracks the percentage of clients who book multiple services. Industry limousine benchmarks suggest healthy services maintain 40-60% repeat rates for corporate clients and 15-25% for leisure customers.
Net Promoter Score (NPS) gauges customer satisfaction and referral likelihood. Scores above 50 indicate strong brand advocacy, while negative scores signal that service improvements are needed immediately.
These metrics interconnect with operational efficiency: satisfied customers cost less to retain than new ones cost to acquire through paid marketing channels.
How Do You Measure Fleet and Resource Utilization?
Fleet utilization rate is the cornerstone metric for limousine service profitability. Industry benchmarks show top-performing services achieve 65-75% utilization during peak seasons, while average operators hover around 45-55%.
Vehicle downtime analysis reveals hidden profit drains many operators overlook. Track maintenance hours, inspection time, and unexpected repairs separately from scheduled downtime. The most efficient services keep total downtime below 8% monthly, counting both planned and unplanned interruptions.
Driver productivity metrics go beyond hours worked to include revenue per driver hour and completed trips per shift. High-performing services achieve $85-120 in revenue per driver hour while keeping service quality scores above 4.5 stars.
Resource allocation efficiency becomes increasingly critical as competition accelerates in 2026. Monitor your dispatch efficiency, measuring the time from booking confirmation to vehicle assignment, alongside route optimization success rates.
The most revealing efficiency metric combines all resources: total asset utilization, which divides gross revenue by the combined value of fleet, facility, and equipment assets. Leading operators aim for annual ratios that exceed their total asset value, generating more in yearly revenue than their assets are worth combined.
These efficiency benchmarks directly influence your ability to scale while maintaining profitability margins, setting the foundation for sustainable growth strategies.
Which Traditional Limo KPIs Can Mislead Operators?
The limousine industry still clings to outdated performance indicators that obscure actual profitability patterns. Traditional thinking treats gross revenue and vehicle count as the primary success indicators, yet these surface-level measurements often mislead operators about their true financial health.
Revenue per mile frequently takes precedence over profit per trip in conventional dashboards, creating a dangerous blind spot. A $200 airport transfer covering 40 miles appears less attractive than a $150 corporate run spanning 15 miles, despite the shorter trip delivering superior margins after fuel and labor costs. This backwards logic explains why many operators report growing revenues alongside shrinking bank accounts.
The obsession with fleet utilization rate is another area where industry wisdom misaligns with reality. Conventional operators chase 80% utilization targets without considering that peak utilization often correlates with discounted pricing and razor-thin margins. Smart operators recognize that strategic capacity management, maintaining 65-70% utilization at premium rates, typically generates superior profitability.
Dismissing all traditional metrics is equally dangerous, though. Customer satisfaction scores and on-time performance remain predictive indicators of long-term success, particularly as digital review platforms amplify service failures. The key is to balance operational efficiency metrics with profitability indicators rather than prioritizing volume-based measurements that reward busy unprofitability over strategic growth.
Summary Table: Limousine Service KPI Benchmarks for 2026
The following benchmarks represent realistic targets for profitable limousine operations, compiled from industry analysis and market forecasting data:
| Metric Category | KPI | Target Range | Profitability Impact |
|---|---|---|---|
| Fleet Efficiency | Vehicle utilization rate | 65-75% | High |
| Service Quality | On-time delivery rate | 96-98% | Critical |
| Customer Experience | Customer retention rate | 80-85% | High |
| Financial Performance | Gross profit margin | 35-45% | Critical |
| Operational Control | Cost per mile | $0.85-$1.15 | Medium |
| Growth Indicators | Revenue per vehicle/month | $8,500-$12,000 | High |
Premium service operators typically achieve the higher end of these ranges through purpose-built limo dispatch software and proactive maintenance schedules. Market conditions in 2026 suggest that even mid-tier operators can reach these benchmarks with focused improvement.
The most critical insight from these benchmarks? Fleet utilization and on-time delivery rate drive everything else. Companies that master vehicle scheduling while staying punctual build the foundation for superior customer retention and premium pricing power, which lifts every other metric.
What Are the Limitations of These KPI Benchmarks?
While these benchmarks provide useful guidance, several limitations affect how you apply them. Market conditions vary dramatically across metropolitan areas, so applying a blanket benchmark can mislead in specific regions or service niches.
The biggest consideration is customer acquisition cost, which fluctuates with local competition density and marketing channel effectiveness. A benchmark of $85-120 per acquisition may prove unrealistic in saturated markets like New York or Los Angeles, where costs can exceed $200 per customer during peak seasons.
Economic volatility is another challenge. Revenue can fluctuate meaningfully during downturns, making static benchmarks less reliable in uncertain periods.
Fleet composition also skews benchmark applicability. Companies operating only luxury vehicles face different maintenance cost structures than mixed fleets, and corporate-focused operations see different seasonality than wedding and event services.
Technology adoption adds variables. Operators using advanced dispatch systems typically achieve better utilization but face higher operational costs initially, and those transitional periods can temporarily distort performance against established benchmarks.
Understanding these limitations helps operators adapt benchmarks to their circumstances rather than treating them as universal targets.
Bottom line: Key Takeaways for Limousine KPIs in 2026
The path to limousine service profitability in 2026 depends on mastering a core set of KPIs that directly affect your bottom line. Successful operators maintain fleet utilization rates above 65%, achieve customer retention rates exceeding 75%, and sustain gross profit margins of at least 40%.
The most important insight is customer lifetime value. Companies that focus on CLV tend to build more durable revenue than those chasing individual transaction profits, because strategic retention programs and consistent service quality turn one-time riders into repeat clients.
Remember that benchmarks are guideposts, not rigid rules. Your market conditions, operating model, and customer base will influence which metrics matter most. The operators thriving in 2026 will adapt these benchmarks to their circumstances while focusing on the fundamentals: efficient operations, exceptional service, and strategic customer relationship management.
Start by implementing measurement for your top three priority KPIs, then expand your analytics as your team becomes comfortable with data-driven decisions.
Frequently Asked Questions
What are the most important limousine service KPIs to track?
Most operators start with four foundational metrics: fleet utilization rate, on-time performance, gross profit margin, and customer retention rate. Together these cover operational efficiency, service quality, financial health, and long-term revenue. Tracking them side by side gives a balanced view instead of over-focusing on gross revenue alone.
What is a good fleet utilization rate for a limo company?
Industry benchmarks often cite 65-75% utilization during peak seasons as a healthy target, with average operators falling closer to 45-55%. Higher isn't always better, though, because pushing utilization toward maximum can require discounted pricing that erodes margins. The goal is balancing steady vehicle use with profitable rates.
How is revenue per available vehicle hour (RevPAVH) calculated?
RevPAVH divides total revenue by the number of hours vehicles are available to generate income, similar to the hotel industry's revenue per available room. It shows how effectively you turn fleet availability into earnings. Reviewing it alongside cost per hour helps you set pricing that protects margins.
Which KPIs help forecast long-term profitability?
Leading indicators like customer lifetime value, repeat customer rate, and booking-to-service conversion tend to predict long-term profitability more reliably than lagging financial figures alone. They reveal whether customers keep coming back and whether marketing spend is paying off. Pairing them with customer acquisition cost shows the true return on each new client.
How can software help track limousine KPIs?
Booking, dispatch, and reporting tools can automate KPI tracking by pulling live data from reservations, GPS and fleet tracking, and payments into one dashboard. LimoFlow includes reporting and analytics alongside online booking, dispatch, and driver tools, plus a CRM with booking-level marketing attribution and ad conversion tracking, so you can follow many of these metrics in one system. You can book a demo, review pricing, or compare options in the software directory to find the features that fit your operation.
Sign Up For Our Limo Marketing Newsletter
Sign up for SMS updates on strategies and tips to increase bookings.